How I used professional poker to become a data scientist

By Daniel Poston — This article originally appeared on Springboard’s Medium.
April 15th, 2011, is referred to as Black Friday in the poker community. It’s the day that the United States Government shut down the top three online poker sites. About 4,000 US citizens played online poker professionally back then, and thus the exodus began. Canada and Costa Rica were popular destinations. I’m from Southern California, so I’m no stranger to Baja California. I decided to set up shop south of the border in a town called Rosarito, Mexico.
As I prepared to move down to Baja, I was often asked, “What happens if this doesn’t work out?” Playing online poker requires a solid understanding of data, probability, and statistics. Back then I knew of only one other profession that utilized a similar skill set. My response was, “I’ll probably end up working as an analyst on Wall Street.”
That same month, the movie Moneyball was released. Based on Michael Lewis’s nonfiction book of the same name, the movie takes place during the 2002 season of the Oakland A’s. Using data analysis strategies similar to Wall Street analysts, the team at the A’s revolutionized baseball. They won a record 20 games in a row on a shoestring budget. This was the moment that data analytics went mainstream. One year later, Thomas H. Davenport and D.J. Patil published Data Scientist: The Sexiest Job of the 21st Century in the Harvard Business Review. Glassdoor.com has ranked data scientist as the top job in the US for 2016 and 2017.
Get To Know Other Data Science Students
Jasmine Kyung
Senior Operations Engineer at Raytheon Technologies
Ginny Zhu
Data Science Intern at Novartis
Leoman Momoh
Senior Data Engineer at Enterprise Products
What data analysis has in common with poker
I began transitioning to a career in data science in 2016. I’ve noticed that much of what I learned during my poker career is relevant to customer segmentation. Where a poker player is from (geographic segmentation), how the player thinks (psychographic segmentation), and how the player plays (behavioral segmentation) are all very important factors when determining a strategy against that player. I learned during my poker career that these factors could be boiled down to a couple of simple statistics. I could tell how good a player was based on just two numbers. To test this theory, I built a K-Means model to segment my poker opponents, much like a company would segment their customers.
The data for this project was generated during my playing career. I played No-Limit Texas Hold’em cash games and the stakes ranged from $25 buy in ($0.25 Big Blind) to $200 buy in ($2 Big Blind). I usually played 15–20 tables at a time, each table having eight or nine players, which resulted in about 600 hands per hour. I have the most data at the $25 buy-in games because it’s the most popular game. I used the data at this level from 2013 where I won $1,913.13 over 387,373 hands, which was a small fraction of the hands I played that year.
Each time a poker hand is played at an online poker site, a hand history is generated that explains everything that each player did during the hand. I used software called Hold’em Manager (think Tableau for poker), which downloads each of these hand histories in real time to a PostgreSQL database so you can keep track of your opponent’s tendencies. These tendencies are visualized as a Heads-Up-Display at the poker table and it looks like this:
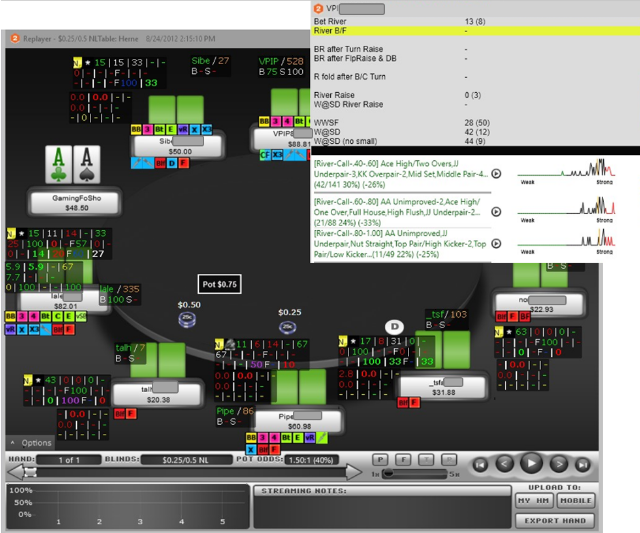
How I used data analytics to outmaneuver my opponents
In Texas Hold’em, each player is dealt two cards at the beginning of the hand which means there are 1326 starting hand combinations you can be dealt. For those who aren’t familiar with how Texas Hold’em is played, click here for a full explanation. As a hand progresses, it’s necessary to make assumptions about the range of hands your opponent may be holding. Having statistics on an opponent’s tendencies is powerful because it makes it very easy to accurately assume your opponent’s range. For example, some players rarely raise Pre-Flop so their Pre-Flop Raise (PFR) percent is low. If an opponent has a 2% PFR, I know they only have about 26 of the 1326 starting hand combinations in their range. Since they are likely to raise with the best hands, and AA, KK, and AK have 28 combinations, I have a solid idea of what they have.
[During each poker session, I would mark any hand that confused me and go back and review it at the end of the day. For an in-depth look at how to use probability and statistics to maximize expected value using actual hands, and actual opponent statistics, click here.]
The two statistics that I focused on to determine if an opponent was a good player or not were PFR percent, mentioned above, and ‘Voluntarily Put Money in Pot’ (VP$IP) percentage. VP$IP percent is the frequency with which a player plays a hand when first given an opportunity to bet or fold. Those two stats, and the ratio between the two, gave me most of the information I needed to determine if a player was a winner (a Shark) or a loser (a Fish).
The Pareto Principle, named after economist Vilfredo Pareto, states that for many events, roughly 80% of the effects come from 20% of the causes. This suggests that 80% of a company’s profits are likely generated from about 20% of their customers, and 80% of my profits were likely generated from about 20% of my opponents.
I identified the 20% of my opponents who I had the highest win rate against (Fish), and the 20% who I had the highest loss rate against (Sharks). I built a K-means model with five clusters to segment my opponents, using eight statistics that measure important playing tendencies as variables. Once segmented, I identified the segment with the highest concentration of Fish, and the one with the highest concentration of Sharks. For each segment, I averaged the opponent’s VP$IP percent and PFR percent. My hypothesis was that the Sharks would have a VP$IP and PFR most similar to my VP$IP and PFR, and the Fish would have the highest VP$IP and biggest difference between the two stats.
The Shark
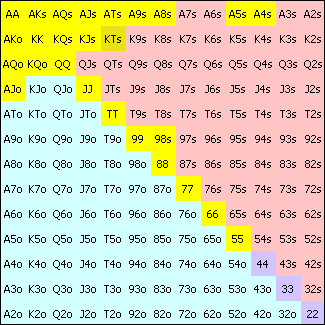
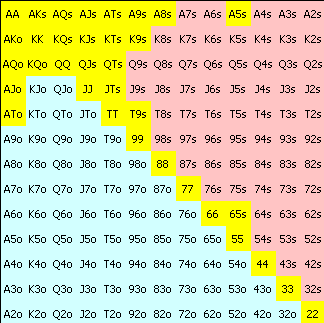
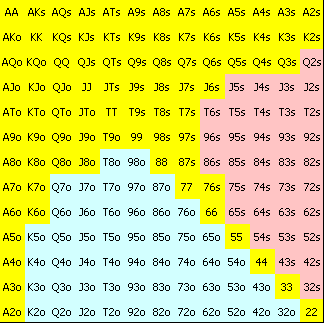
In the Shark segment, opponents on average have a VP$IP of 15.1% and a PFR of 11.7%. The image on the top approximates what a 15.1% VP$IP range looks like, and the image on the bottom approximates an 11.7% PFR range. The hands highlighted in yellow are the hands these players typically play. As you can see, these images are similar and consist mainly of good starting hands. These players fundamentally understand two things.
- There is no reason to put money in the pot if you don’t have a good starting hand so it’s better to fold.
- When you do have a good starting hand, it is better to play aggressive and raise. The fundamental reason why playing aggressive poker is more profitable than passive poker is because betting and raising give you two ways to win; having the best hand or causing your opponents to fold. Your opponents can’t fold if you don’t bet.
These opponents cost me money at the poker table, but how might this look for a company? Let’s say we’re an online retailer selling widgets. We can probably learn a lot about our potential customers by how many pages of our website they’ve viewed along with the specific pages they’ve viewed. How each person interacts with the website will show a pattern of behavior. A segment that views a limited number of pages, and mostly pages that sell low-profit margin widgets may indicate a pattern of behavior that consistently results in low or no profit customers. Once identified, we can avoid allocating resources to these potential customers.
The Fish
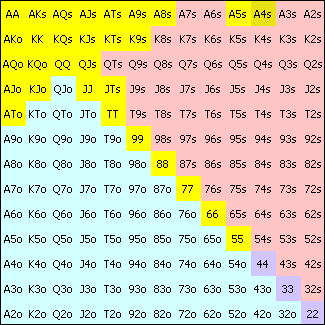
In the Fish segment, opponents on average have a VP$IP of 43.8% which is approximated by the image on the top and a PFR of 14%, approximated by the image on the bottom. These images are not similar. These players are voluntarily putting money in the pot almost three times as often as Sharks. This indicates they are frequently playing with mediocre or even bad starting hands, and what’s worse is they’re playing them passively. Playing bad hands passively costs money at the poker table, and that money goes into my pocket. I never sat at a poker table that didn’t have at least two Fish playing.
Let’s go back to our online widget retailer analogy. What might their highest value segment look like? This segment probably views a high number of web pages, and spends time on pages that sell the widgets with the highest profit margins. High value customers might be arriving through certain landing pages, or might gravitate to certain blog posts. It could even be as simple as the time spent on the website. Once a potential customer is identified as being part of this high value segment, we’d want to allocate resources to convert them into customers, such as adding them to a targeted marketing campaign or having a salesperson reach out.
I’ve found that the game of poker is a microcosm of life. What holds true at the poker table will often have a corollary in many other aspects of life. There are a few key principles I learned during my poker career that I’ll share with you.
- Everybody thinks they’re great at poker, but most people are terrible at it. When you make a living off people lying to themselves, you realize that everyone lies to themselves. It takes a lot of effort to be honest with yourself and others, but it’s worth it.
- It’s always your fault. This is your first line of defense against lying to yourself. To improve at poker, you must be self-critical. You can’t learn from your mistakes if you blame them on someone or something else. If you don’t make a sale during your presentation, or don’t land that data science job, take the time to figure out what you did wrong, and don’t make that mistake again.
- Make decisions based on logic and reason, not ego and emotion. Ego and emotion cost a lot of money at the poker table.
- In games of luck and skill, those who gather information most efficiently and utilize it most effectively, usually win in the long run. So do your homework and take the time to research the company you’re about to interview with, and the hiring manager who’s conducting the interview.
- Don’t be passive. The best strategy is usually selective aggression. Selective aggression at the poker table means betting and raising with strong hands and occasional bluffs, rather than passively calling or checking. In business it means asking for the sale when you send your proposal, rather than just sending the proposal and hoping the deal closes itself. Fortune favors the bold.
Data science is gradually infiltrating our daily lives. We can put our data analysis skills to good use and turn our passion into profit. As a result, new opportunities for data scientists in numerous fields are emerging.
P.S. In case you’re curious, over the 387,373 hands played, my VP$IP was 15.6% and my PFR was 12.2%, and the Fish segment had the highest average VP$IP. You can review the code that I wrote to segment my poker opponents here.
Since you’re here…
Thinking about a career in data science? Enroll in our Data Science Bootcamp, and we’ll get you hired in 6 months. If you’re just getting started, take a peek at our foundational Data Science Course, and don’t forget to peep our student reviews. The data’s on our side.


