Data Science Process: A Beginner’s Guide in Plain English

In this article
While data scientists often disagree about the implications of a given data set, virtually all data science professionals agree on the need to follow the data science process, which is a structured framework used to complete a data science project. There are many different frameworks, and some are better for business use cases, while others work best for research use cases.
This post will explain the most popular data science process frameworks, which ones are the best for each use case, and the fundamental elements comprising each one.
What Is the Data Science Process?
The data science process is a systematic approach to solving a data problem. It provides a structured framework for articulating your problem as a question, deciding how to solve it, and then presenting the solution to stakeholders.
Data Science Life Cycle

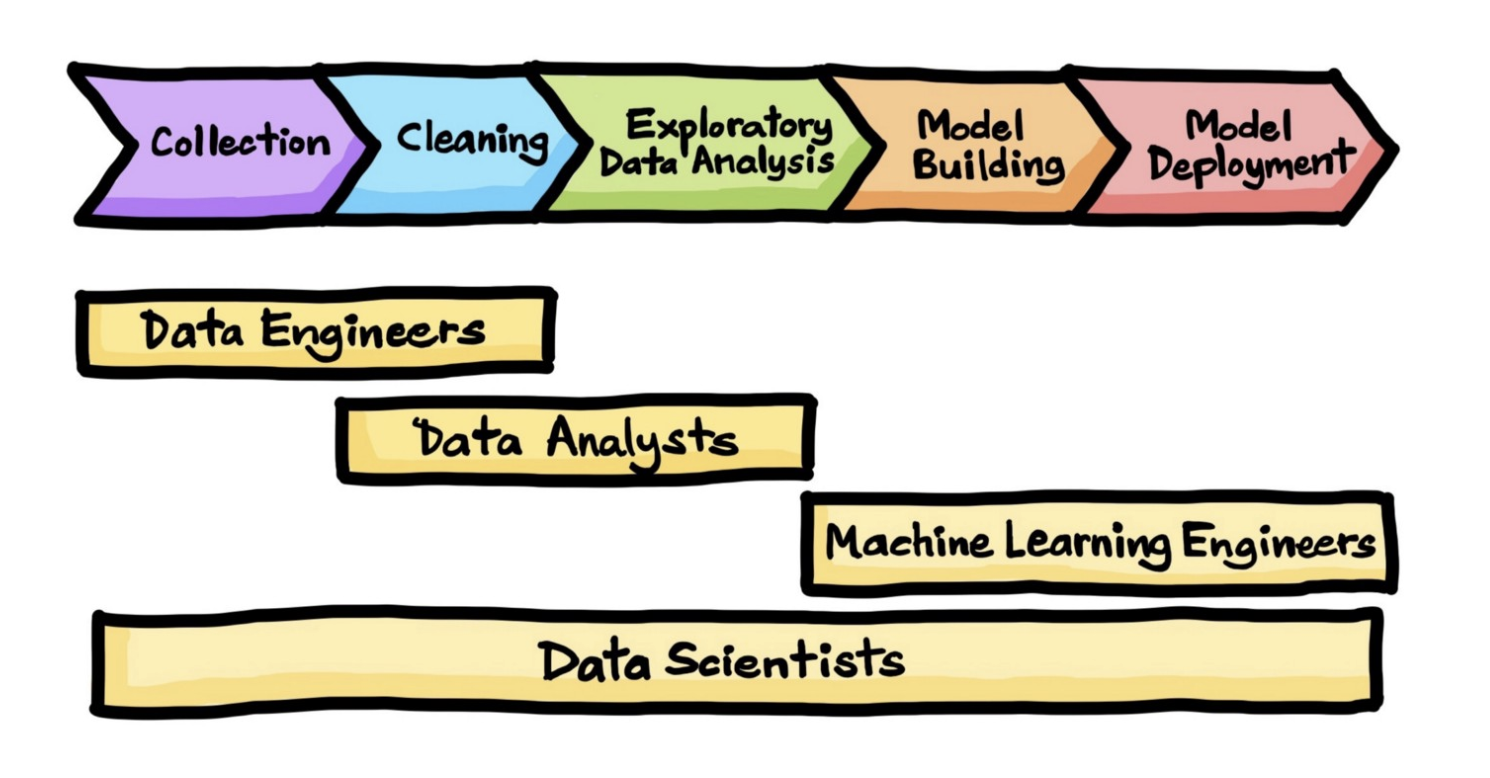
Another term for the data science process is the data science life cycle. The terms can be used interchangeably, and both describe a workflow process that begins with collecting data, and ends with deploying a model that will hopefully answer your questions. The steps include:
Framing the Problem
Understanding and framing the problem is the first step of the data science life cycle. This framing will help you build an effective model that will have a positive impact on your organization.
Collecting Data
The next step is to collect the right set of data. High-quality, targeted data—and the mechanisms to collect them—are crucial to obtaining meaningful results. Since much of the roughly 2.5 quintillion bytes of data created every day come in unstructured formats, you’ll likely need to extract the data and export it into a usable format, such as a CSV or JSON file.
Cleaning Data

Most of the data you collect during the collection phase will be unstructured, irrelevant, and unfiltered. Bad data produces bad results, so the accuracy and efficacy of your analysis will depend heavily on the quality of your data.
Cleaning data eliminates duplicate and null values, corrupt data, inconsistent data types, invalid entries, missing data, and improper formatting.
This step is the most time-intensive process, but finding and resolving flaws in your data is essential to building effective models.
Exploratory Data Analysis (EDA)
Now that you have a large amount of organized, high-quality data, you can begin conducting an exploratory data analysis (EDA). Effective EDA lets you uncover valuable insights that will be useful in the next phase of the data science lifecycle.
Model Building and Deployment
Next, you’ll do the actual data modeling. This is where you’ll use machine learning, statistical models, and algorithms to extract high-value insights and predictions.
Get To Know Other Data Science Students
Hastings Reeves
Business Intelligence Analyst at Velocity Global
Jonathan King
Sr. Healthcare Analyst at IBM
Aaron Pujanandez
Dir. Of Data Science And Analytics at Deep Labs
Communicating Your Results
Lastly, you’ll communicate your findings to stakeholders. Every data scientist needs to build their repertoire of visualization skills to do this.
Your stakeholders are mainly interested in what your results mean for their organization, and often won’t care about the complex back-end work that was used to build your model. Communicate your findings in a clear, engaging way that highlights their value in strategic business planning and operation.
Data Science Process Steps and Framework
There are several different data science process frameworks that you should know. While they all aim to guide you through an effective workflow, some methodologies are better for certain use cases.
CRISP-DM
CRISP-DM stands for Cross Industry Standard Process for Data Mining. It’s an industry-standard methodology and process model that’s popular because it’s flexible and customizable. It’s also a proven method to guide data mining projects. The CRISP-DM model includes six phases in the data process life cycle. Those six phases are:
1. Business Understanding

The first step in the CRISP-DM process is to clarify the business’s goals and bring focus to the data science project. Clearly defining the goal should go beyond simply identifying the metric you want to change. Analysis, no matter how comprehensive, can’t change metrics without action.
To better understand the business, data scientists meet with stakeholders, subject matter experts, and others who can offer insights into the problem at hand. They may also do preliminary research to see how others have tried to solve similar problems. Ultimately, they’ll have a clearly defined problem and a roadmap to solving it.
2. Data Understanding
The next step in CRISP-DM is understanding your data. In this phase, you’ll determine what data you have, where you can get more of it, what your data includes, and its quality. You’ll also decide what data collection tools you’ll use and how you’ll collect your initial data. Then you’ll describe the properties of your initial data, such as the format, the quantity, and the records or fields of your data sets.
Collecting and describing your data will allow you to begin exploring it. You can then formulate your first hypothesis by asking data science questions that can be answered through queries, visualization, or reporting. Finally, you’ll verify the quality of your data by determining if there are errors or missing values.
3. Data Preparation

Data preparation is often the most time-consuming phase, and you may need to revisit this phase multiple times throughout your project.
Data comes from various sources and is usually unusable in its raw state, as it often has corrupt and missing attributes, conflicting values, and outliers. Data preparation resolves these issues and improves the quality of your data, allowing it to be used effectively in the modeling stage.
Data preparation involves many activities that can be performed in different ways. The main activities of data preparation are:
- Data cleaning: fixing incomplete or erroneous data
- Data integration: unifying data from different sources
- Data transformation: formatting the data
- Data reduction: reducing data to its simplest form
- Data discretization: reducing the number of values to make data management easier
- Feature engineering: selecting and transforming variables to work better with machine learning
4. Modeling
There are multiple options for data modeling. You’ll choose which option is best based on the goals of the business, the variables involved, and the tools available.
When selecting your modeling technique, you’ll produce two reports. The first one will specify the modeling technique you’re going to use. The second will document the assumptions your modeling report uses—if your model requires a specific type of data distribution, for example.
Once you’ve chosen your modeling technique, you’ll design tests to determine how well your model works. For this step, your deliverable will be your test design. This may entail splitting your data into training data and testing data to avoid overfitting, which happens when you design a model that perfectly fits one set of data but doesn’t work with others. It is essential to avoid introducing any bias into your data in this phase.
Next, you’ll build your model to address your specific business goals. When you do this, you’ll deliver three items:
- A list of parameter settings
- A description of the models
- The models themselves
The final step in the modeling phase is to assess your models. You’ll review them from both technical and business standpoints. Subject matter experts on your project team may also participate in reviewing your models.
A model assessment will summarize the conclusions of your model review, including a ranking of models if you’ve developed more than one. At this time, you may revise your parameters and conduct another round of modeling.
5. Evaluation

In the evaluation phase, you’ll evaluate the model based on the goals of your business. Then, you’ll review your work process and explain how your model will help the business, summarize your findings, and make any corrections.
Finally, you’ll determine your next steps. Is your model ready for deployment? Does it need a new iteration or another dependency project?
6. Deployment
While deployment is the last phase in the CRISP-DM methodology, it’s not necessarily the end of your project. During the deployment phase, you’ll plan and document how you intend to deploy the model and how the results will be delivered and presented. You’ll also need to monitor the results and maintain the model during the deployment phase.
You’ll conclude your project by creating a summary report and presentation. Afterward, plan to review the entire process to determine what worked and what needs improvement.
OSEMN
Unlike CRISP-DM, OSEMN is not an iterative process. It’s not as widely used as CRISP-DM, but it’s more valuable for certain use cases.
Because it omits business-oriented phases, it’s ideal for projects focusing on exploratory research, and is often used by research institutions and public health organizations. With OSEMN, you’re more interested in what the data have to say, as opposed to asking specific questions.
Obtain Data

Because OSEMN is not goal-driven, the first phase is to obtain data. As with other frameworks, you can use several tools—including web scraping, APIs, or SQL—to obtain your data.
Scrub Data
Regardless of what you plan to do with your data, it must be scrubbed before it has any value. Even clean data might need to be reformatted to make it usable. This is the most important step in any data project.
Explore Data
Exploring your data helps you develop a better understanding of any preliminary trends and correlations you see. You aren’t testing any hypotheses or evaluating any predictions yet. Some methods you can use to explore your data in this phase include:
- Command-line tools
- Histograms to summarize data attributes
- Pairwise histograms to discover relationships and highlight outliers
- Dimensionality reduction methods
- Clustering to uncover groupings
Model Data
The ultimate measure of a successful model is how accurate it is. Usually, the most predictive model is the best model. You can measure your model’s predictive accuracy by how well it performs on novel data.
Data modeling is accomplished with machine-learning techniques using supervised or unsupervised algorithms. Supervised learning uses labeled datasets designed to train the model to make predictions or accurately classify data.
Unsupervised learning uses algorithms to cluster and analyze unlabeled datasets. Unsupervised learning models are helpful for uncovering hidden patterns and correlations.
Although both types of algorithms may be used, unsupervised models are particularly useful in the OSEMN process because they can help you find patterns you may not be aware of when you start your project.
Interpret Results
The final step in the OSEMN model is to interpret your results. At this point, it’s important to note that a model’s predictive and interpretive powers don’t always coincide and may even conflict. A highly predictive model may make it harder to interpret the results, not easier.
A model’s ability to predict relies on its ability to generalize, while a model’s interpretative power can provide insights into a problem or domain. You may want to find a model with a good balance of predictive and interpretive capabilities, or you may want to focus on one over the other. It all depends on your project goals.
Related Read: Understanding Data Wrangling + How (and When) It’s Used
What Is the Significance of the Data Science Process?

Following the data science process gives your work structure and order. If you follow a proven formula, your workflow can proceed smoothly, and you can be sure that you aren’t forgetting something. A good data science process gives you confidence in your results because it’s proven to produce the most accurate results.
The data science process you choose will guide you through the necessary steps for collecting data, transforming it into a high-quality input, building and evaluating models, and interpreting and sharing your results. If you’re interviewing for a data science job, showcase projects that follow the data science process to demonstrate your knowledge.
FAQs About the Data Science Process
Which Is the Most Crucial Step in the Data Science Process?
The most crucial step in the data science process is data cleaning. The computer programming adage “garbage in, garbage out” also applies here. If your data is inaccurate, irrelevant, incomplete, or contains errors, your results will be worthless.
Most data scientists spend most of their time on a project in the data processing stage because the quality of the data is directly proportional to the quality of the results. No model, no matter how elegant or complex, can overcome noisy or junky data.
Is the Data Science Process Hard To Learn?
The data science process itself is not hard to learn. However, some steps in the data science process can be difficult to learn. Building machine learning models requires specialized math and programming knowledge.
Are You Required To Use the Data Science Process?
You aren’t required to use a specific data science process, but it is important to follow a data science process framework. There are many to choose from, so find the one that works best for your project. Data science processes may vary, but they all contain the essential elements for doing good work. Following an established process also makes it easier for other data scientists to understand your work.
Since you’re here…
Thinking about a career in data science? Enroll in our Data Science Bootcamp, and we’ll get you hired in 6 months. If you’re just getting started, take a peek at our foundational Data Science Course, and don’t forget to peep our student reviews. The data’s on our side.


