30 Statistics Interview Questions to Prep For Your Interview

In this article
At some point in the data science job interview process, you’re going to have to sit down for a technical interview. And chances are that you’ll be asked a few questions about statistics, given that statistics is both foundational to the field of data science and because data science use statistics frequently and on a daily basis.
This interview can be one of the most daunting parts of the entire interview process. With a portfolio, you can spend as much as you have tinkering with the projects that show off your best work. With an interview, you have to be able to think on your feet.
If that sounds anxiety-inducing, then you’re in the right place. Below, we’ve detailed thirty of the most common statistics interview questions that data science candidates get asked. Study these questions, and you’ll be well on your way to acing the interview and landing your dream job.
What’s the Best Way To Practice Statistics Interview Questions?
The best way to practice statistics interview questions is to learn and understand the fundamentals of statistics rather than just memorizing answers. You should also practice answering questions in a clear and concise way, to show that you can think critically when under pressure.
Technical Statistics Interview Questions
Here are some of the most common questions asked during the interview process and how to answer them.
What Are Some Key Concepts in Statistics?
Statistics is the study of data. It’s an important field that helps scientists, analysts, and researchers make sense of large amounts of information. There are several key concepts in statistics that can help you better understand what it is and how it works.
We’ll discuss four of them here: population and sample, standard deviation, covariance and correlation, and probability.

A population is a collection of elements that have specific characteristics in common. For example, all the people who live in a particular city are part of that city’s population. A sample is a subset of the population being studied. It has been selected to reflect the characteristics of the population as a whole but is not necessarily representative of the entire group.
Standard deviation measures how far away from the average value for a set of values something is likely to be. It’s calculated by taking all those values, finding their mean (average) value, and then calculating their percentage from that mean value.

Covariance and correlation measure how two sets of data relate to each other; they represent whether there’s any kind of pattern between them or whether one set causes changes in another set over time by using random variables.
Finally, probability represents how likely something might happen given certain conditions or how unlikely it would be given those same conditions (for example: “The probability that it will rain tomorrow is 30%”).
What Are Descriptive Statistics?
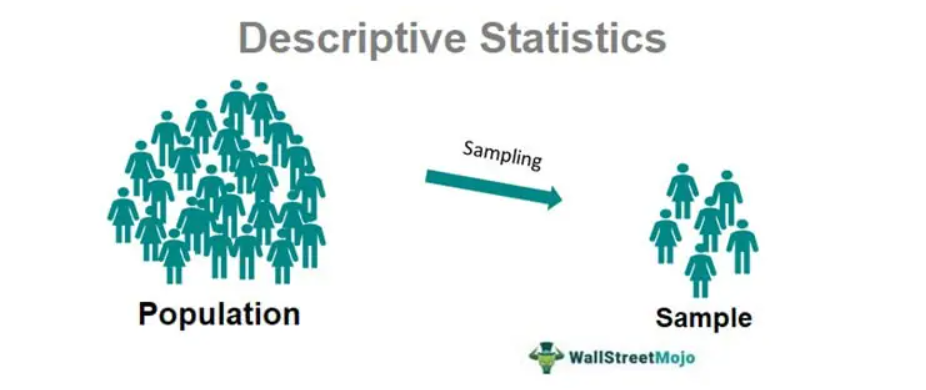
Descriptive statistics are a set of numbers that describe a group or population, and they’re usually used to summarize information about a set of data.
For example, if you’re looking at the average height of the male population in your country, you might use descriptive statistics to find out that the mean height is 5’11”. Descriptive statistics can be used to describe any kind of data—from test scores to how much money a company makes during a year.
What Is the Difference Between Inferential Statistics and Descriptive Statistics?

The difference between inferential statistics and descriptive statistics is that inferential statistics are used to draw conclusions about a population based on the data you’ve collected. In contrast, descriptive statistics are used to summarize your data.
What Is the Difference Between Population and Sample in Inferential Statistics?

In inferential statistics, the difference between population and sample is that a population is the complete set of objects in a specific category. In contrast, a sample is a subset of that category.
You can think about it like this: if you have a jar full of marbles, the entire contents of the jar are the “population”—that’s all the marbles. But if you randomly remove ten marbles from the jar, those ten marbles are your “sample.”
What Is the Difference Between Quantitative Data and Qualitative Data?

Quantitative data is numerical data that can be measured, counted, and expressed as a percentage. For example, if you have 100 people in a room, how many of them are women? If you ask them to fill out a survey and write down their age and gender, that would be quantitative data.
Qualitative data is non-numerical information that describes subjective experiences or opinions about an event or topic. Qualitative data can be examined using methods like surveys and interviews. For example, if you wanted to understand how people feel about sports, you might ask them questions like: “What kind of sports do you like?” or “How much time do you spend watching sports?”
Explain the Central Limit Theorem.

The Central Limit Theorem is a mathematical principle describing how the mean of a large number of samples approaches their population mean as the sample size increases.
It’s important because it can be used to test an alternative hypothesis about populations by looking at the means of random samples from those populations.
For example, if you gather 100 samples from a population and find that they all have a mean equal to some number, you can conclude that the population’s mean is also equal to that number.
Get To Know Other Data Science Students

Aaron Pujanandez
Dir. Of Data Science And Analytics at Deep Labs

Leoman Momoh
Senior Data Engineer at Enterprise Products

Pizon Shetu
Data Scientist at Whiterock AI
What Is Sampling? What Are the Different Sampling Methods? List Some Examples of Sampling Biases.
Sampling is collecting information from a population to make inferences about the whole. It’s used in statistical analysis, scientific research, and other fields.
There are many different sampling methods: simple random sampling, stratified random sampling, systematic sampling, cluster sampling, convenience sampling (also known as judgmental or non-probability sampling), and quota sampling. These methods have their strengths and weaknesses that can result in some form of selection bias.
Sampling bias occurs when the sample does not represent the population it is supposed to represent. This can happen if the sample is too small or biased towards certain groups of people who are more likely to answer questions or participate in surveys.

Some examples of biases that can occur in a sample include:
- Self-selection: where people volunteer for a study because they believe they will benefit from it (e.g., they want to win a prize);
- Recruiting at places where people tend to congregate (e.g., bars).
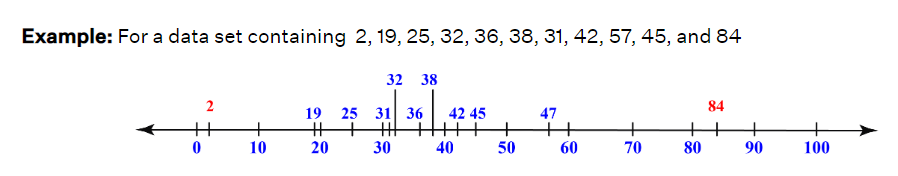
How Do You Calculate Range and Interquartile Range?

Range and interquartile range are two ways to calculate the spread of data. The range is the difference between the highest and lowest value in a set of data. The interquartile range is the difference between the 75th percentile and 25th percentile of a set of data.
To calculate the interquartile range, first, you need to sort your data from smallest to largest. Then find the 75th percentile by calculating three-quarters of the way across your sorted list (i.e., 3/4 = .75). Next, find 25% of your sorted list by calculating one-fourth of the way across your sorted list (i.e., 1/4 = .25). Finally, subtract these numbers; this is your interquartile range.
To calculate the range: find the absolute value difference between each number in your list and add all those differences.
What’s the 5-number Summary, and How Do We Visualize It?

The five-number summary is a statistical description of a data set. It consists of the smallest value, the largest value, the median, the first quartile, and the third quartile.
The five-number summary can be visualized with box plots or histograms. A box plot shows the normal distribution of data using boxes extending from one quantile (the 25th percentile) to another (the 75th percentile). A histogram shows the distribution by giving equal area to bars representing each value in a data set.
What Is the Relationship Between Standard Deviation and Variance?

Standard deviation and variance are statistical measures of how values within a data set are distributed. The standard deviation measures the average distance between each value in the data set and the mean, while variance measures how much each value in the data set varies around its mean.
The standard deviation is always greater than or equal to the variance, regardless of which method is used to calculate either. This is because standard deviation accounts for only one measure of dispersion (distance from the mean), whereas variance accounts for two: distance from the mean and each other.
Explain the Following:
Pareto Principle

The Pareto Principle, also known as the 80-20 rule, is a principle that states that 20% of causes are responsible for 80% of effects.
The principle was named after Italian economist Vilfredo Pareto, who noticed that 80% of his country’s land was owned by 20% of the population. He found this to be true in other places and industries as well—that a small portion of causes (and effects) were responsible for a large portion of what happens.
In statistics, this means that while many variables are at play in any situation, only a few will account for most of the results you see. For example, suppose you wanted to predict how many people will come to an event based on how much money you spend on advertising alone. In that case, you’d need to know which variables accounted for most of the total amount spent on advertising (e.g. which variables had the most significant impact).
Three-Sigma Rule

The Three-Sigma Rule is a statistical concept that states that if you have a sample of data and want to determine the probability that the average of your sample will fall within three standard deviations of the actual value, you must calculate the appropriate z-score using a normal distribution.
For example, we have a sample of five values, and they are 2, 5, 7, 10, and 11. The average of those values is 6.2. Let’s say we want to determine our chances that this average will fall within three standard deviations of the true value, which would be between 6.5 and 7.5. We can do this by calculating Z = (6 – 6.5) / 0.5 = -0.1, then plugging this into our calculator to find that our chances are about 70%.
Law of Large Numbers
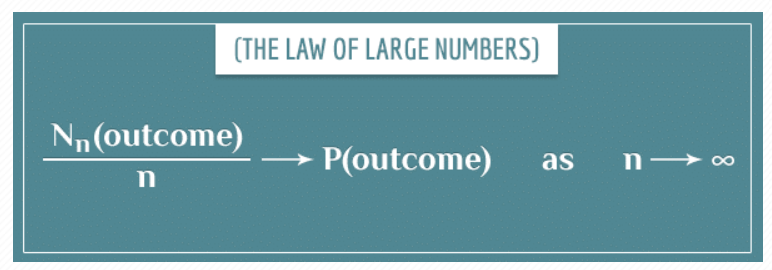
The Law of Large Numbers states that the average of many trials is close to the expected value. It is a fundamental principle of probability theory used to describe how an experiment’s results converge on the true value as more and more trials are conducted.
What Are Left-Skewed Distribution and Right-Skewed Distribution?

Left-skewed distributions have a longer tail to the left (lower values), while right-skewed distributions have a longer tail to the right (higher values).
For example, if you were looking at the distribution of test scores on an exam, a left-skewed distribution would mean that more students scored lower than average than higher than average. A right-skewed distribution would mean that more students scored higher than average than lower than average.
What Is an Outlier, and How Can You Find One?
An outlier is an observation point that is distant from other data points. It’s important to note that the term “outlier” doesn’t refer to the numerical value of a data point but rather the distance between it and all other values.
You can use statistical tools like box plots or stem-and-leaf plots to find outliers in your dataset.
Describe:
Cherry-Picking

Cherry-picking is a term used in statistics to describe the practice of selecting data points that support a conclusion. It’s also called data mining or using an inappropriate statistical test.
In statistics, cherry-picking can be done intentionally or unintentionally. If a researcher wants to prove that one treatment is better, they might use only the data points that support their claim and discard any that don’t fit their narrative. On the other hand, if a researcher doesn’t know what they’re doing or doesn’t realize that they’re making decisions about what data points to include and exclude, they could accidentally be cherry-picking their data set.
P-Hacking or Data Dredging

Source: geckoboard
P-hacking or Data Dredging is manipulating data to get the desired result. You can do this by changing the way you analyze your data until you get the desired outcome. This is not a good way to conduct research because it means that you’re not actually looking at your data objectively, and you’re more likely to find false positives (results that seem significant but are not).
Significance Chasing
Significance chasing is the practice of using statistics to confirm a hypothesis rather than using it to explore unproven ideas. This is done by setting a very low threshold for significance and then either finding barely statistically significant results or manipulating data to achieve statistical significance.
Significance chasing is unethical and ineffective because it leads researchers to draw conclusions that are not well-supported by the data.
If Four Coins Are Tossed Simultaneously, What Is the Possibility of Getting Three Heads and One Tail?
The probability of getting three heads and one tail is ¼ or 25%.
How Many Possible Permutations Does a License Plate With 5 Digits Have?
There are 100,000 permutations of a license plate with five digits. This can be found by multiplying the number of possible digitals (ten) five times.
Take a Fair Dice. On Average, How Many Times Must You Roll the Dice Before Rolling a Six?
On average, you’ll need to roll the dice about four times before you land on six.
How Would You Go About Finding the Mean Height of Women in the World?
To find the mean height of women worldwide, you should gather data from surveys of women across all countries. Then, use appropriate statistical methods to calculate an average for each country. Finally, create a mean for all countries combined using these numbers and mathematical formulas.
Two Fair Dice Are Rolled Together. What Is the Probability of Getting a Total Of:
3
The probability of getting a total of 3 when two fair dice are rolled together is 1/18. This is because there are 36 possible outcomes when two dice are rolled, and only two of them result in a three.
10
The probability of getting a total of 10 when two fair dice are rolled together is 1/9. This is because there are 36 possible outcomes for the roll, and four of them result in a 10.
You Have To Draw Three Cards Successively From a Full Deck of Cards. What Is the Probability That You Draw a Face Card, a Seven, and a Two in That Order?
The probability that you draw a face card, a seven, and a two in that order is 1/676. You can find this by multiplying the chances of pulling each card respectively.
There are twelve face cards in a deck, so the chance of pulling a face card is 1/4.
There are only four seven cards in a deck, so the chance of pulling a seven is 1/13.
There are only four two cards in a deck, so the chance of pulling a two is also 1/13.
How Would You Go About Choosing a Sample Size?

There are a few ways to choose the sample size, but the most common method is to use the margin of error (ME) formula. The margin of error is the amount of error expected in your result. You can use this formula to determine the desired sample size.
Choose a sample size by first identifying the population of interest. Then, decide on a sample size that will allow you to represent that population accurately.
A good rule of thumb is to have a maximum sample of around 10% of the population.
Why Is Bessel’s Correction Important?

Bessel’s correction is important because it allows us to solve differential equations, which tell you how an unknown function (the output) changes in time or space depending on the values of the dependent variables (the inputs).
General Statistics Interview Questions

Questions about statistics are common in many data science interviews. These questions help employers gain insight into your ability to perform statistical analysis, your understanding of the fundamentals of data analysis, and your ability to communicate knowledge of statistics.
Related Read: Data Science Interview Preparation: 7 Tips to Succeed
Tell Me About Yourself.
This is an opportunity for the interviewer to get a sense of who you are, what motivates you, and what kind of person they might be working with.
Keep this answer succinct, though it’s essential to remember that the person asking this question wants to know more about who you are, not just your job history. In addition to describing your background and education, consider what aspects of your personality make you unique and interesting.
What Made You Choose a Career in Data?
When answering this question, consider how your answer will help the interviewer get to know you better. If specific things about your personality or background make you well-suited for this type of work, now is the time to bring them up.
Tell them about hobbies or past experiences that relate directly to what you do now. For example: “I’ve always been interested in data science because it allows me to put my love of math and science into practice.” Or “I’ve always been fascinated by statistics because they allow us all to think critically about the world around us.”
What Have You Done To Improve Your Skills in Statistics?
Talk about your qualifications, such as data science online courses or bootcamps. Mention all the accreditations and how these courses helped you learn more about the topic.
It’s always a good idea to talk about your experience, such as working with data sets provided by companies online. This experience gives you an idea of how these companies collect data from their customers, what information they look at when making decisions about their products or services, and how they use this information to improve their business.
What Statistical Analysis Software Are You Familiar With?
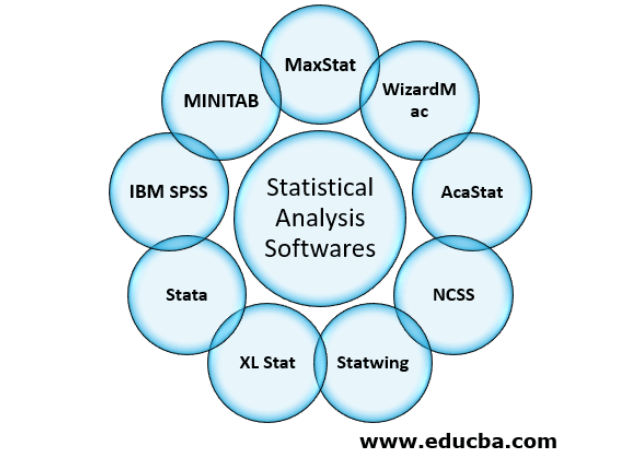
When asked about software, you want to highlight the fact that you’re familiar with a variety of software. You should also highlight your analytical thinking and problem-solving skills, as these are two key traits employers look for when hiring statisticians.
You might say, “I’m familiar with both Excel and Stata. I’ve used them for statistical analysis in different fields, including economics, psychology, and ecology.”
You could also mention that you have experience using other software packages such as SPSS or R (or both).
What Differentiates You From Other Candidates Applying for This Role?
The ability to differentiate yourself from other candidates is an important skill, especially in a job interview. It’s important to explain how your background, experience, and skills make you stand out from other applicants.
Try using examples from your experience or personal life that illustrate how you’ve been able to accomplish something unique or challenging.
For example, if you’re applying for a job as a statistician, you could talk about how you helped manage the data collected by an extensive survey project back when you worked at the local health department. Or, if you’re applying for a role in marketing research, talk about how you were able to help develop the first-ever mobile app for collecting customer feedback on a new product line.
How Would Your Boss and Colleagues Describe You?
If you’re applying to a statistics job, you might be asked how your boss and colleagues would describe you. This is a great chance to show what kind of person you are. It’s important to be honest and friendly but also confident and professional.
You can talk about the things you like doing outside work, like sports or hobbies. You can mention that your boss is impressed by your ability to think creatively and solve problems. You may also mention that others have described you as organized or detail-oriented.
Be specific. Don’t say that you’re a hard worker. Explain how much effort you put into every task. Don’t say you’re organized—explain how much time it takes to stay organized and how efficient it makes your workday. Use examples from past jobs or internships to illustrate these qualities.
What Does Your Ideal Career Path Look Like? How Do You See This Role Helping You Achieve That?
You may be asked to talk about your ideal career path during a statistics job interview. This is an excellent opportunity to show your potential employer that you have thought about how this role will help you achieve your goals.
First and foremost, it’s important not to get too general. Instead of saying, “I want to be a statistician,” say something like, “I love working with data and statistics, and I’m excited to see where this role can take me.”
Next, consider what qualities you’d like to develop or hone to reach your goals. For example, if you want to work as a statistician in a lab setting, you should mention that you’re interested in developing long-term planning or goal-setting capacity. Or, if you’re interested in applying statistics to business settings, mention that you’d like some experience managing projects or setting priorities.
Finally, don’t forget about the skills required for this position! Just because someone has the title “statistician” doesn’t mean they know everything there is to know about using math equations—there are other areas of expertise that could come into play depending on where they work (e.g., programming).
Do You Have Any Questions for Us?
This is a favorite question of hiring managers. It’s a way to end an interview on a positive note and ensure that you leave with a good feeling about the company.
However, it can be tricky to come up with questions, especially if you’re nervous about not knowing enough about the position or company. Here are some tips for answering this question effectively:
- Be prepared for the question by considering what things would be essential to know about the position or company before accepting an offer. For example, do they use any specific programs or technology? Do they have a lot of travel required? Do they expect employees to stay late sometimes? Make sure these questions are answered before asking them!
- Show interest in their business and culture by asking questions related to those topics (for example: “What is your favorite part about working here?” or “How did you get started in your field?”).
FAQs About Statistics Interview Questions
We’ve got the answers to your most frequently asked questions.
How Do I Prepare for a Statistics Interview?
Preparing for a statistics interview is a lot like preparing for any other job interview: You want to ensure you’re prepared and confident. The best way to get ready is to practice answering questions, so try making up some sample questions and coming up with answers that you think would work in an interview.
You should also spend some time brushing up on the basics of statistics, including what it is, how it’s used in business and government, and what kinds of jobs use statistics.
Is a Statistics Interview Difficult?
A statistics interview can be difficult, but there are ways to help you prepare.
First, you need to understand what the interviewer is looking for. A statistics interview is not just a test of your ability to answer questions correctly; the interviewer wants to know how well you can think on your feet and how quickly you can come up with creative solutions to complex problems. The more experience you have with statistics, the better off you’ll be in this type of interview.
Second, make sure that you show up well-prepared for any possible question that might come your way. This means having a solid understanding of statistics and data analysis techniques and applying these skills in new situations or unexpected circumstances. It’s important to be able to explain yourself clearly, so practice telling stories about your past experiences where those skills were used.
How Long Does a Statistics Interview Generally Last?
In general, statistics interviews last between 30 minutes and an hour. However, this can vary depending on the length and complexity of the questions. It could take longer than an hour if they’re asking you to solve a problem or do data analysis.
How Can You Stand Out in a Statistics Interview?
You can stand out in a statistics interview by being confident, honest, and prepared.
First, show that you’re confident by answering questions in a way that shows that you’re not afraid to speak up or ask for help when needed. For example, if the interviewer asks a question and you don’t understand it, don’t be afraid to say so.
Second, be honest about your strengths and weaknesses—and show how you’ve overcome them. For example, if there’s a particular skill or topic in which you aren’t as strong as others may be, explain how you’ve worked to get better at it over time.
Finally, ensure that you’re prepared with plenty of examples of how your past experience makes you the best candidate for the job and what makes those experiences relevant to the position.
Since you’re here…
Thinking about a career in data science? Enroll in our Data Science Bootcamp, and we’ll get you hired in 6 months. If you’re just getting started, take a peek at our foundational Data Science Course, and don’t forget to peep our student reviews. The data’s on our side.


