9 Big Data Projects To Grow Your Skills [Or Land a Job]

In this article
Big data is all the buzz in the software industry right now. Businesses across the board have woken up to the power of being able to analyze very large volumes of data. The big data market was valued at just $35 billion in 2017 but is projected to almost triple in size by 2027.
So if you’re looking to break into the big data industry, then you’re probably going to face some competition given the booming market. One of the ways to set yourself apart from other candidates is by working on personal projects that can help you build your skills. Building your own data analysis projects shows recruiters that you are passionate about the field and that you have the ability to apply theoretical know-how to solving a real-world problem.
We’re going to cover a few big data project ideas that you can work on if you’re trying to build your portfolio and enhance your skills so you can land a job. If you’re early in your career, then start with a simple project and then move on to the more advanced projects slowly.
What Is Big Data?
Big data is exactly what it sounds like. It’s quite simply a very large volume of organized or unorganized data.
A good example of big data is the data that comes from social media. Every day, hundreds of terabytes of data are uploaded on websites like Instagram and Twitter. The data takes the form of images, text, and video on most occasions. Companies that have big data capabilities with some help from techniques like machine learning, artificial intelligence, and neural networks can process that data to gain insights into their customers’ behavior online.
There are four main characteristics that you need to take stock of when working with big data. They are:
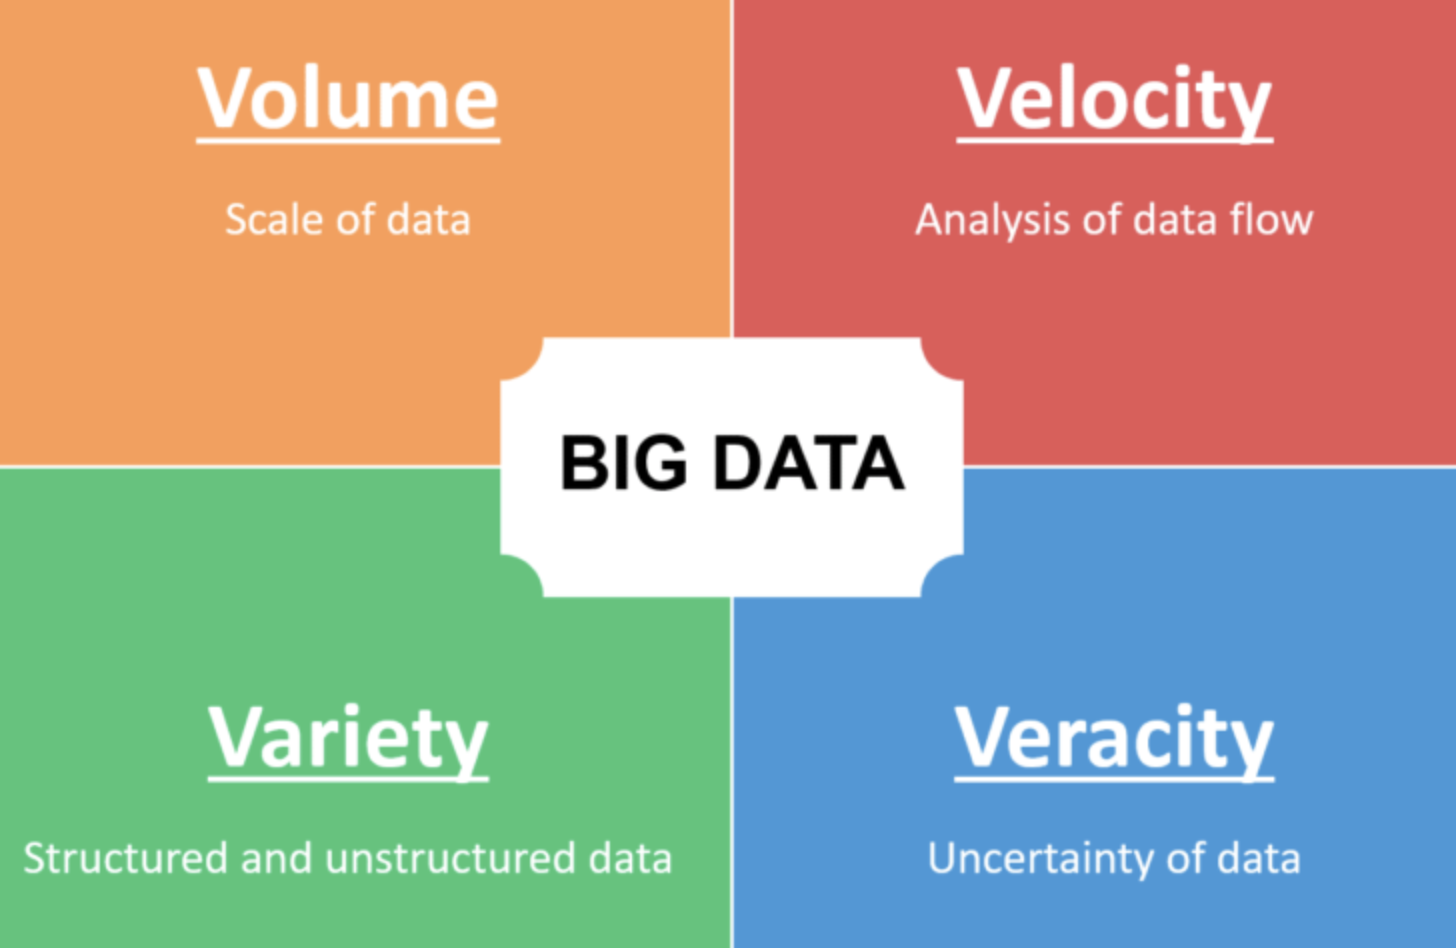
Volume
The most obvious feature of a big dataset is the volume of data that is in it. The size of the data that you’re dealing with will determine how you approach analyzing it to unearth insights that can guide business strategy.
Variety
There are two kinds of variety that you should be aware of when it comes to big data.
The first is the variety in the sources from which the data is coming. Nowadays, there’s often a wide range of sources from which you can obtain your data. That includes social media sites, websites, email, etc.
Variety also refers to the nature of the data itself. It is possible that you’re dealing with a dataset that has many different kinds of data. In that case, you will need to use different techniques to be able to analyze each different data type.
Velocity
A big data set is not a static entity. There’s always new data streaming in from various sources. You need to take the speed at which your data is updated into consideration, especially if you’re working on a real-time analysis project.
Variability
Variability refers to how often you run into outliers or other unexpected values in your sourced data. This is a feature that will determine how easily you’re able to obtain insights and whether your data structures and algorithms need to account for constant variations in data.
Get To Know Other Data Science Students

Bryan Dickinson
Senior Marketing Analyst at REI

Haotian Wu
Data Scientist at RepTrak

Meghan Thomason
Data Scientist at Spin
What Is a Big Data Project?
A big data project is a data analysis project that uses a very large data set as the basis for its analysis. Any data set larger than a terabyte would be considered big data.
Big data projects combine traditional data analysis techniques with others that are tailored to handle large data volumes. Big data engineers often use deep learning, convolutional neural networks, machine learning, and computer vision as part of their analysis process.
A High-Level Understanding of Big Data Projects
What Is the Goal?
The goal of a big data project is to be able to mine data and analyze it to uncover underlying patterns. Modern data-driven companies like those in the banking sector and e-commerce industry use big data to understand their customers better and guide business strategy.
What Is the Process?
The following are the steps involved in a big data project:
Define the Problem
This is common to most projects that you’ll work on as a data scientist or data analyst. You need to understand what business challenge you’re dealing with right at the outset. This will guide all of the rest of the decisions you take on the project.
Related Read: What Is Data Science? and What Is Data Analytics?
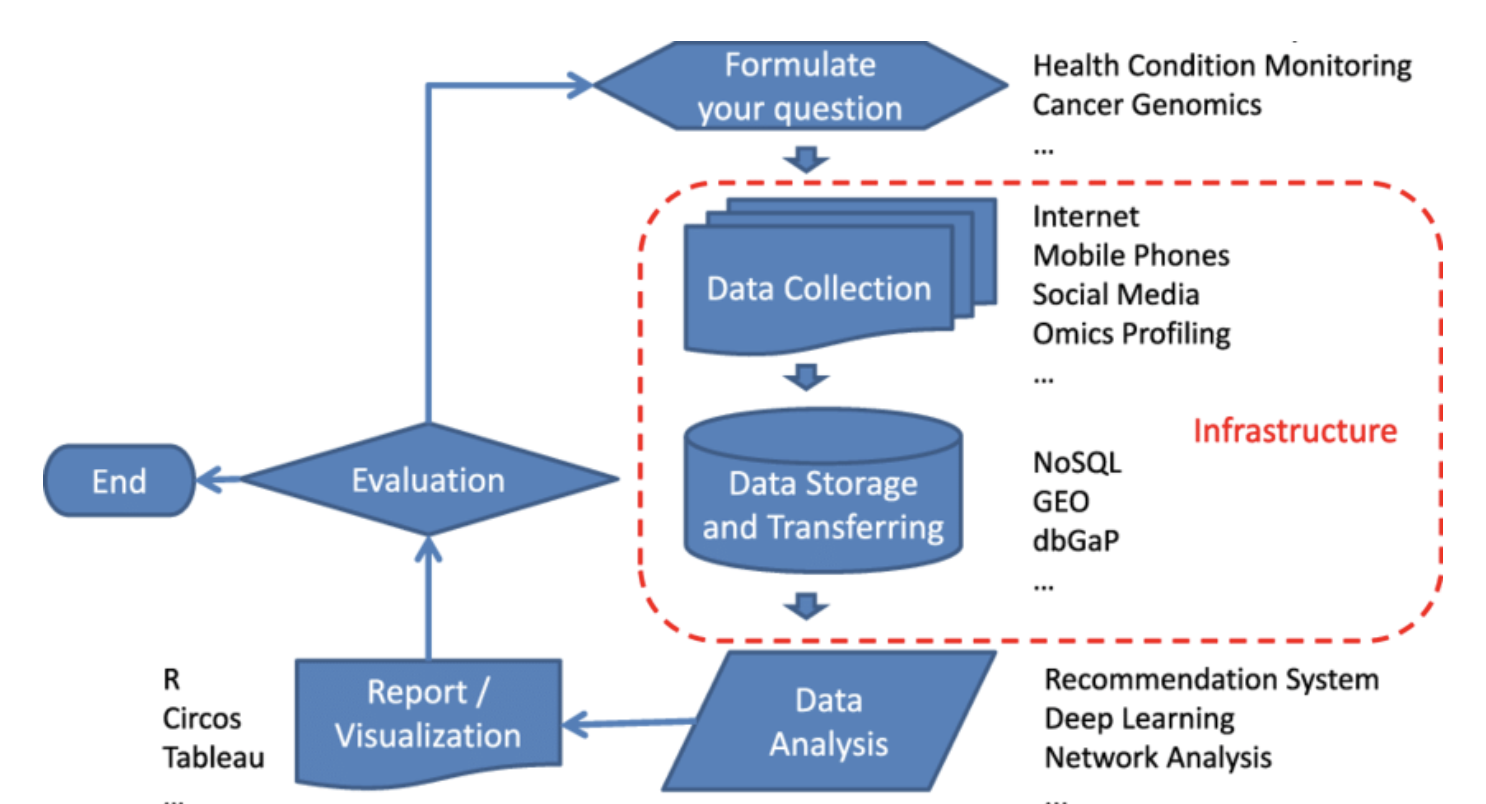
Source the Data
Source: Analytics India Magazine
You can source data in a few different ways for a big data project. There are various open data sources that you can tap for large volumes of structured data. Another source of data is your company itself. You could approach your database team to find out what kind of data they have access to and how you can use it.
APIs are another great data source. You can use them to source data from various websites and online services.
Clean the Data
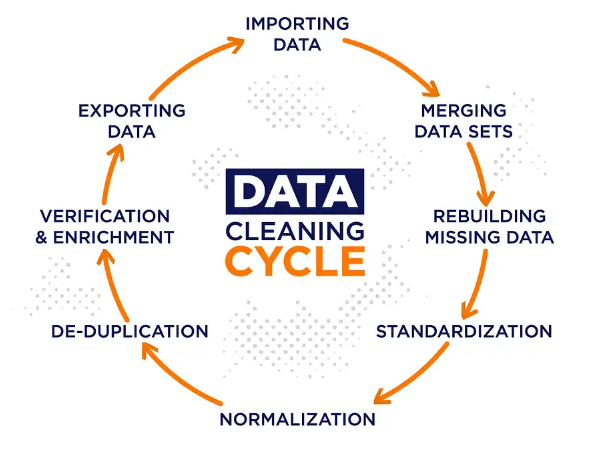
Source: Iterators
The data that you source will most often not be ready for analysis right away. You’ll find that there are many missing entries and erroneous values present in it. Data cleaning is the process of identifying and correcting such entries so that the data is ready for analysis.
Analyze the Data
This is when the real fun begins. Once you have a source of clean, structured data, then you can move on to studying it. The way you go about this will depend on the nature of the data. For example, if you’re working with photos, then you’ll need to use image processing techniques to analyze the data.
You can also tap into artificial intelligence and machine learning techniques to automate parts of your data analysis process.
Build Data Visualizations
Data visualization is an underrated skill in the data analysis process. Transforming some of your data into visuals can help you spot patterns that you might not have otherwise. Visualizations can also play a major role in communicating your findings to other stakeholders in an effective manner.
What Is the Outcome?
The final result of a big data project is an analysis that reveals certain patterns in the data or helps solve a specific business challenge. The results of the analysis can be presented using various visualizations to make it comprehensible to a lay audience.
Big Data Project Ideas
Let’s take a look at some big data projects that you can add to your data science portfolio.
Beginner
Here are some big data projects ideas if you’re just starting out.
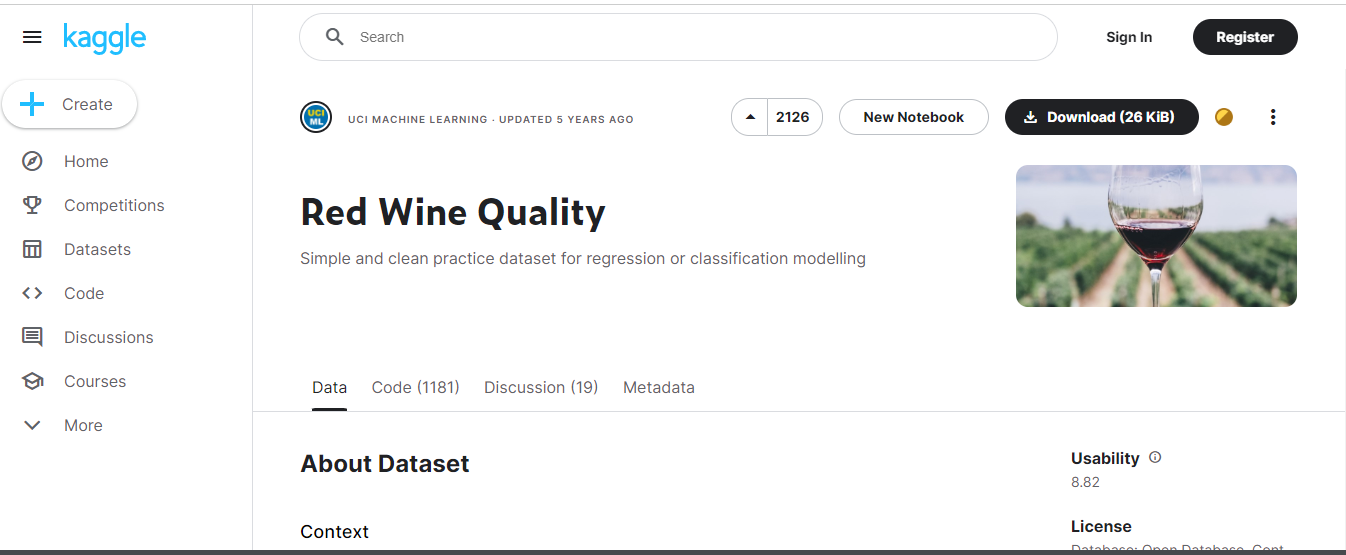
Red Wine Quality
What counts as a good red wine? This is a question that you might think has a different answer depending on who you ask. But there are characteristics pertaining to acidity, pH, density, and other factors that can predict a wine’s quality.
The dataset provides data on those chemical inputs along with data on the sensory variables involved. The two together form the input and output, allowing you two study how people react to different red wines.
This big data project will test your knowledge of regression, which is a technique that any data scientist should be familiar with.
You can find the dataset for this project here.
US Pollution Data
Trends in pollution data are an important area of study for several reasons. For city and state administrations, they can be an important indicator of the quality of life in different areas. They can also be a way for businesses to gauge their own impact and enhance their environmental practices.
This dataset provides data on four pollutants: carbon dioxide, sulfur dioxide, ozone, and nitrogen dioxide. It spans the years between 2000 and 2016, so you get a good cross-section of data. You can use it to study trends in the presence of these pollutants in different counties and states in the US.
Olympic Medals
This is a fairly straightforward dataset with data on medal winners at the summer Olympics from 1976 to 2008. For each medal, it provides information on the athlete’s gender, country, event, and discipline.
You can use this dataset to study various trends in Olympic winners. This data set is also an excellent opportunity to work on some of your Excel skills. It is possible to do data analysis with Excel and you don’t need to always rely on advanced data analysis techniques to get the job done.
Advanced
Ready for some more advanced projects? Check these out:
Data Scraper

Source: WebHarvy
A data scraper is a tool that scrapes data from a source like a website or a directory. The goal of this project is to build a tool that is able to consistently source quality data from a given source and store it in a database.
You can make the data scraper as simple or advanced as you want, depending on the level of difficulty that you’re looking for. You can build a very simple data scraper tool using Python. To take the level of difficulty up a notch, you could build a GUI that displays a real-time analysis of the data that the tool is scraping, with stats on the data volume, data types, etc.
Analyze a Current Event
A large-scale event, like a big product launch or election, tends to send ripples out into the world and influence business outcomes in many different ways. A fun project idea is building a data analysis tool that studies a specific event and the impact that it has on different stakeholders in a system.
The COVID-19 pandemic is an example of one event that you can study. You can look at cross-sectional job market data along with COVID trends to create a report on how the event affected jobs in different industries.
Improve the Visualization of an Existing Project
As we said earlier, it’s important for data scientists to have good visualization skills. Improving the visualization of an existing big data project can be a project in itself. The goal here is to identify correlations that you can study in better ways through visualization.
For example, this visualization depicts changes in the job market between March and April 2020, which is when the COVID-19 pandemic first began to have a big impact on business and life.

You can build similar visualizations to depict your findings and examine your data in new ways.
Expert
These big data projects are some of the most challenging, and rewarding.
Recommendation System
Recommendation systems are used by many different consumer companies to recommend new products and items to their customers. Think about how Netflix recommends new shows to you or Amazon displays products that you might like. What makes those things possible are recommendation systems that study patterns in user behaviors and predict consumer choices.
You can take an e-commerce dataset like this one as the source for your project. Go about looking at patterns in how customers buy products and see if you can make recommendations based on that.
This is a project where you can flex your technical muscle if you would like to. You can make use of artificial intelligence and supervised and unsupervised learning techniques to build a highly accurate recommendations system. You can use these to study the behavior of billions of input values at a time.
Social Media Sentiment Analysis Tool
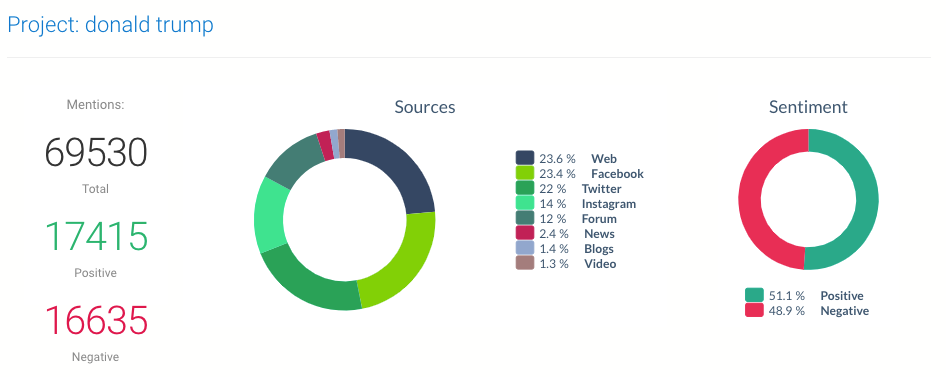
Sentiment analysis is an application of natural language processing to gauge the sentiment in a textual dataset. This is an easy one to source data for because you can tap into just about any social media feed as your input.
Related Read: 9 NLP Project Ideas for Beginners
To make things more specific, you could choose a specific hashtag. Let’s say Apple has just launched a new iPhone and you want to know how people feel about it. You can source Tweets with the hashtag “iPhone” or “iPhone13” and then carry out a sentiment analysis on it to make that happen. The tool you build can take into account both the text and emojis that are used in Tweets to carry out the analysis.
Read more about how to do sentiment analysis in the R programming language here.
Custom Detection System
Big data can be used to find patterns in images and videos and detect specific elements within them eventually. This is an application that is widely used for medical purposes.
Let’s say you have images for cancer detection. These can include scans and MRIs that have been sourced anonymously from healthcare providers. It is possible to get millions of these images daily, which means that you can use big data techniques combined with a deep learning model or machine learning algorithms to study them.
You can also build a detection system for instances like detecting cell structures from histology images or gender detection of animals from images sourced from farms or national parks.
What Makes a Good Big Data Project?
Whether you’re a beginner or an expert, you’ll want to consider the following when evaluating a big data project.
Quality Over Quantity
The field is called big data so there is a tendency to value the quantity of data that you’re working with over the quality of the data analysis that you’re doing. Always remember that the goal of big data analysis is the same as any other data analytical undertaking: to mine insights that can support business objectives and inform business decisions.
Given that that’s the main goal, you need to make sure that you foreground quality over quantity every time. That means studying a variety of sources from which to obtain your data, choosing the right algorithms to process it, and interpreting the results in the right way.
Focus on Impact and Outcome
The work that you do as a big data analyst is ultimately about helping meet business objectives. So what you’re trying to maximize is not the volume of data that you work with or the number of fancy technologies that you use. Rather, the impact that you’re trying to make is to help your organization make its business strategy defensible by being data-driven.
For that reason, a good big data engineer is also one who has business savvy. The ability to combine technical chops with a strong understanding of business strategy will make you eligible for key roles in world-class companies.
Clean Code and Analysis
This is something that has to do with how you work as an individual and in a team. Always write code that is clean, which means that it is formatted in the right and has comments wherever required. This will make it easier for you as you advance in the project and for your colleagues if they need to continue your work at a later point.
As you write code to analyze the data, try to keep your methods as fair and mission-focused as possible. It is very easy to let biases and a range of emotions get in the way of accurate data analysis. Watch out for these pitfalls as you work on more and more projects.
How To Leverage Your Big Data Projects
You have a wide range of options when it comes to ways in which you can use your big data projects to further your career.
First off, make sure that you upload your code on a tool like Github. Technical recruiters often look at a candidate’s Github profile to examine the code they produce.
Once you’ve got a few big data projects under your belt, then it’s time to start building your portfolio. Portfolios have become a necessary part of the interview process. They centralize all of the work that you’ve done and show recruiters what you’re capable of.
Finally, you can also mention some of your projects in your resume. This can’t be as extensive as your portfolio so make sure that you only mention projects that are relevant to the job that you’re applying for.
Big Data Project FAQs
We’ve got the answers to your most frequently asked questions.
Why Are Big Data Projects Important?
Before big data emerged as a field, software engineers didn’t really have a way to study very large volumes of data because of the limitations of traditional methods. Big data is important because it helps business executives and companies unearth insights that can help them make better, more profitable decisions.
How Long Will a Big Data Project Take To Complete?
A big data project can take anywhere between a couple of weeks to a few months to complete. The duration depends on the aims of the project and the volume of data under consideration.
Are Big Data Projects Necessary To Land a Job?
Big data projects can be very helpful if you’re trying to land a job in the industry. Make sure that you upload your code to Github and create a portfolio so that recruiters can easily view the work that you’ve done.
Since you’re here…
Thinking about a career in data science? Enroll in our Data Science Bootcamp, and we’ll get you hired in 6 months. If you’re just getting started, take a peek at our foundational Data Science Course, and don’t forget to peep our student reviews. The data’s on our side.