Introduction to Data Mining: A Complete Guide

In this article
Data mining is the process of finding anomalies, patterns, and correlations within large datasets to predict future outcomes. This is done by combining three intertwined disciplines: statistics, artificial intelligence, and machine learning.
Picking an online bootcamp is hard. Here are six key factors you should consider when making your decision.
Read on to learn more about the uses of data mining in the real world, important distinctions between data mining and other related data functions, and data mining tools and techniques.
What Is Data Mining?
Data mining is an automated process that consists of searching large datasets for patterns humans might not spot.
For example, weather forecasting is based on data mining methods. Weather forecasting analyzes troves of historical data to identify patterns and predict future weather conditions based on time of year, climate, and other variables.
This analysis results in algorithms or models that collect and analyze data to predict outcomes with increasing accuracy.
How Does Data Mining Work?
In the information economy, data is downloaded, stored, and analyzed for most every transaction we perform, from Google searches to online shopping. The benefits of data mining are applicable across industries, from supply chains to healthcare, advertising, and marketing.
Data mining business use cases typically center around personalizing customer experiences.
- For example, Spotify’s AI recommendation engine uses proprietary algorithms to understand a user’s music tastes and point the user towards new genres, artists, and tracks.
- In another example of data mining in business, insurance companies use data mining to evaluate the risk of a life insurance applicant and assign them a corresponding premium.
- Doctors also use data mining to check whether premature babies are developing dangerous infections.
Predictive analytics help businesses personalize user interactions, determine the best time to upsell or cross-sell a customer, identify cost inefficiencies in their supply chain, and analyze user behavior to deduce customer pain points.
Data Mining Process In 5 Steps
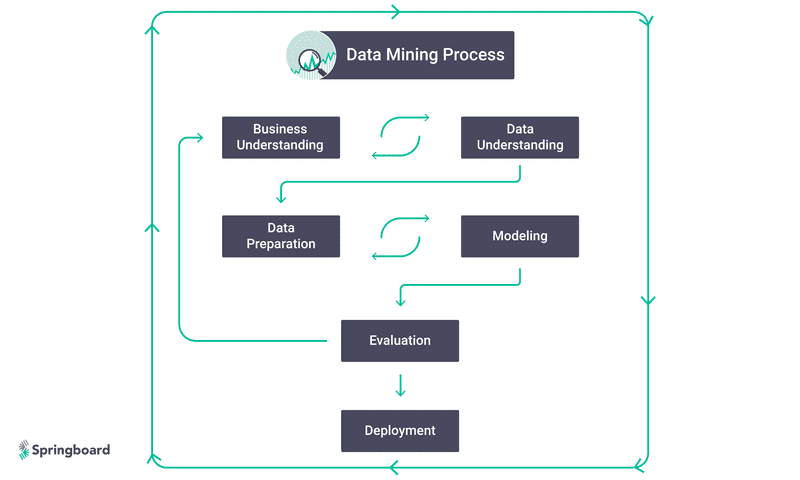
The data mining process consists of five steps. Learning more about each step of the process provides a clearer understanding of how data mining works.
- Collection. Data is collected, organized, and loaded into a data warehouse. The data is stored and managed either on in-house servers or in the cloud.
- Understanding. Business analysts and data scientists will examine the “gross” or “surface” properties of the data, and then conduct a more in-depth analysis from the perspective of a problem statement as defined by the business. This can be addressed using querying, reporting, and visualization.
- Preparation. Once available data sources are confirmed, they must be cleaned, constructed, and formatted into the desired form. This stage may also involve additional data exploration at a greater depth, informed by the insights uncovered in the previous stage.
- Modeling. In this stage, modeling techniques are selected for the prepared dataset. A data model is a diagram that describes the relationships between various types of information stored in a database. For example, a sales transaction is broken down into related groups of data points, describing the customer, the seller, the item sold, and the payment method. Each of these items must be described systematically to be stored and retrieved accurately from a database.
- Evaluation. Finally, the model results are evaluated in the context of business objectives. In this phase, new business requirements may be raised due to new patterns discovered in the model results, or other factors.

What Is Data Mining Often Confused With?
Data mining is often confused with a number of related terms. It’s important to understand how data mining differs from the terms it is often confused with.
- Data mining vs. data analysis. Data mining is a systematic process of identifying and discovering hidden patterns and information in a large dataset. Data analysis is a subset of data mining, which involves analyzing and visualizing data to derive conclusions about past events and use these insights to optimize future outcomes.
- Data mining vs. data science. Data mining falls under the field of study of data science, which also includes statistics, data visualization, predictive modeling, and big data analytics.
- Data mining vs. machine learning. Machine learning is the design, study, and development of algorithms that enable machines to learn without human intervention. Both data mining and machine learning fall under the field of data science, which is why the two terms are often confused. Machine learning can be used to automate data mining processes, and the data gathered from data mining can be used to teach machines.
- Data mining vs. data warehousing. Data warehousing is a process that is used to integrate data from multiple sources into a single database. Unlike data mining, data warehousing does not involve extracting insights from data; it merely concerns the infrastructure for storing, accessing, and maintaining databases.
3 Common Data Mining Applications
Data mining is used across a wide range of industries. Below are three common data mining applications in three fields: marketing, business analytics, and business intelligence.
- Marketing. Big data makes it possible to extract predictive insights about consumers from large databases, enabling businesses to learn more about their customers. For example, an e-commerce company could analyze customers’ past purchases, then use the analytics to target ads and make more relevant product recommendations. Data mining is also used for market segmentation. Cluster analysis enables the identification of a given user group according to common features within a database, such as age, location, education level, and so on. Segmenting the market enables the business to target specific groups for promotions, email marketing, and other marketing campaigns.Some businesses go so far as to use predictive analytics to infer implicit or future customer needs. For example, Target uses customer tracking technology to predict the likelihood that a woman is pregnant based on her purchases and sends specially designed ads in her second trimester.
- Business analytics. Business analytics is the process of transforming data into business insights. While business intelligence is descriptive (providing data-driven insights into current business performance), business analytics is more prescriptive. The focus of business analytics is on recognizing patterns, developing models to explain past events, create predictions for future events, and recommend actions to optimize business outcomes.
- Business intelligence. Business intelligence (BI) transforms data into actionable insights. While data science is mostly focused on analytics, which consists of analyzing trends and predicting the future, business intelligence gives a readout on the current state of the business by tracking key operations metrics in real-time. For example, a BI dashboard could show how many customers are buying a particular item during a promotion, or how many engagements a social media campaign is attracting.
Get To Know Other Data Science Students
Jonas Cuadrado
Senior Data Scientist at Feedzai
Lou Zhang
Data Scientist at MachineMetrics
Meghan Thomason
Data Scientist at Spin
4 Key Data Mining Programming Languages
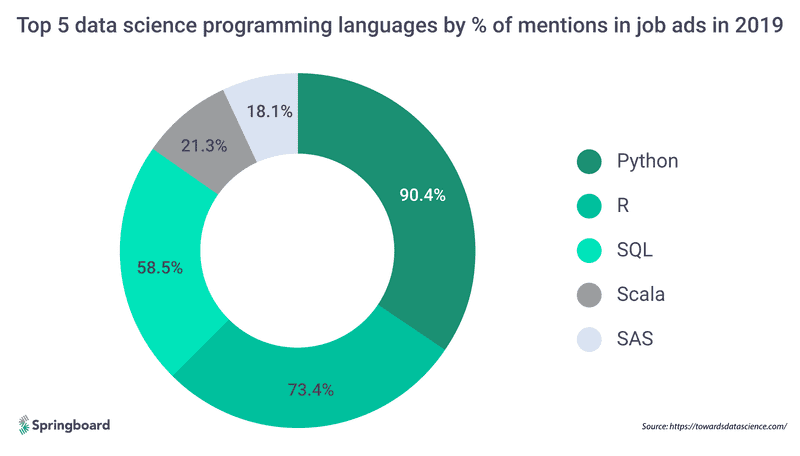
In order to become a data miner, there are four essential programming languages you need to learn: Python, R, SQL, and SAS.
- Python. As one of the most adaptable programming languages, Python can handle everything from data mining to website construction to running embedded systems, all in one unified language. Pandas is the Python data analysis library used for everything from importing data from Excel spreadsheets to plotting data with a histogram or box plot. The library is designed for easy data manipulation, reading, aggregation, and visualization. To learn more about data mining in Python, check out this comprehensive guide.
- R. R is an integrated suite of software facilities for data manipulation, calculation, and graphical display. As the de facto data science programming language, R can be used to solve any problem you encounter in data science. The software can implement machine learning algorithms quickly and simply and provides a variety of statistical and graphical techniques, such as linear and non-linear modeling, classical statistical tests, time-series analysis, classification, and clustering.
- SQL. SQL is a domain-specific programming language designed for managing and querying data held in a relational database management system (a type of database that stores and provides access to data points that are related to one another). You can use SQL to read and retrieve data from a database or update/insert new data. Creating a SQL query is often the very first step in any sequence of evaluation.
- SAS. SAS is a statistical software suite designed for data management, advanced analytics, multivariate analysis, business intelligence, a criminal investigation, and predictive analytics. It enables users to interact with their data using dynamic charts and graphs to understand key relationships.

7 Essential Data Mining Techniques
There are a number of data mining techniques. Below is a breakdown of the seven most essential techniques used by data scientists.
- Anomaly detection. Anomaly detection is the process of identifying instances that are anomalous or worrisome. Some anomalies can be detected by looking for deviations from averages. More sophisticated techniques involve looking for instances that don’t match any cluster or comparing data points with close examples to see if their feature values are vastly differentiated. For example, anomaly detection is used by credit card companies to alert customers to fraudulent transactions made using their credit cards by identifying transactions that don’t fit their typical buying patterns.
- Exploratory data analysis (EDA). Exploratory data analysis postpones any initial assumptions, hypotheses, or data models. Instead, data scientists seek to uncover the underlying structure of the data, extract important variables, and detect outliers and anomalies. Most of this work is done graphically because graphs are the easiest way to visually infer trends, anomalies, and correlations.
- Building predictive models. Predictive modeling is the process of using historical data to create, process, and validate a model or algorithm that can be used to forecast future outcomes. By analyzing past events, companies can use predictive modeling to forecast customer behavior as well as financial, economic, and market risks.
- Classification. Classification is the process of assigning items in a collection to target categories or classes. The goal is to accurately predict the target case for each case in the data. For example, classification helps to categorize loan applicants as low, medium, or high credit risk. This Springboard project—which uses R to analyze Yelp’s data to see if there were ways the rating system could be tweaked to make it easier to pick good Indian restaurants—is a great example of a data mining classification.
- Clustering. Clustering refers to finding items in a dataset with similar properties that can be categorized in the same class. While it might sound similar to classification, clustering is adaptable to changes and helps single out useful features that distinguish different groups. This is how millions of products on eBay are categorized every single day.
- Regression. Regression involves assigning a number to each item in a dataset. These numbers can be weighted (e.g., the probability of an event on a scale of one to 10), or related to time or quantity. The goal is to find an equation or curve that fits the data points, revealing how high the curve should be given any arbitrary input. Many regression techniques give each feature a weight and then combine the positive and negative attributes from the weighted features to generate an estimate.
- Decision trees. A decision tree is a non-parametric machine learning modeling technique for regression and classification problems. The model is hierarchical, meaning it consists of a series of questions that lead to a class label or value. For example, when a bank is considering whether to offer someone a loan, it goes through a sequential list of questions to assess the applicant’s credit risk, ending with a classification of either low, medium, or high risk.
Check out some more examples of applying data mining techniques here.
Essential Data Mining Tools
Data scientists use a range of statistical software applications like Spark and IBM SPSS Modeler to clean, organize, parse, analyze, and visualize data to convert it into usable information.
Thankfully, many data mining tools are open-source and free to use, so anyone can experiment with them.
Learn more about the best available free data mining tools here.
Data Mining: Frequently Asked Questions
Below you’ll find the answers to a number of frequently asked questions on data mining, how data mining is used in business, and more.
Who uses data mining?
Businesses across every industry and sector use data mining to extract business insights from their data, from retail to healthcare, manufacturing, banking, education and more. For example, companies with a low customer retention rate, such as utilities and telecommunications companies, use data mining to predict customer ‘churn’ based on customer behavior.
Data mining has non-commercial use cases, too. Local governments use it to predict graduation rates in their school districts, public health officials use it to predict the spread of infectious disease, and doctors use it to predict whether premature babies might develop dangerous infections.
How is data mining used in business?
In business, data mining is used to interpret and predict customer behavior using data analytics and track operational metrics in real-time using business intelligence.
Data mining helps businesses maximize revenue by discovering customer pain points, identifying opportunities for cross-selling and upselling, and minimizing risks when launching new products or business ventures.
What are the challenges of data mining?
The biggest impediment to effective data mining is poor data quality, such as incomplete data, missing or incorrect values, poor representation in data sampling, or noisy data (data with a large amount of meaningless additional information).
It can also be immensely difficult to integrate conflicting or redundant data from multiple sources and forms, such as combining structured and unstructured data. There is also the high cost of buying and maintaining software, servers, and storage applications to handle large amounts of data.
What makes data mining an important business tool?
Data mining helps businesses make more educated decisions based on real-world conditions. Data mining empowers businesses to develop smarter marketing campaigns, predict customer loyalty, identify cost inefficiencies, prevent customer churn, and personalize the customer experience using recommendation engines and market segmentation.
Does data mining require coding?
Yes. In addition to software, data scientists also use programming languages like R and Python to manipulate, analyze and visualize data.
What are the benefits of data mining?
Data mining empowers organizations to make better decisions based on real-time and historical data. By building models to predict future behaviors, businesses can have a better understanding of their customers, which gives them a competitive advantage.
Raw data in itself is not useful to businesses; it has to be processed and interpreted. Data mining is deployed in different ways across industries. For example:
- Financial institutions use data mining to evaluate a loan applicant’s credit risk and to protect their customers from fraud
- Insurance companies use data mining to decide how much to price their premiums
- Marketers use data mining to determine who will respond to a marketing campaign, and which channels will help them target their ideal customers
- Retailers also rely on data to manage inventory, decide on pricing strategies and even visual merchandising decisions such as knowing where to position certain products
Since you’re here…
Thinking about a career in data science? Enroll in our Data Science Bootcamp, and we’ll get you hired in 6 months. If you’re just getting started, take a peek at our foundational Data Science Course, and don’t forget to peep our student reviews. The data’s on our side.


